With inventories tight across many markets, home buyers are facing increased competition as they fight to snap up the limited number of homes available.
“Attempting to purchase a house in this type of market can make the already complex process of buying a home even more overwhelming,” the National Association of Realtors said in a recent release.
As such, the NAR has come up with a number of suggestions for home buyers looking to navigate today’s extremely competitive market:
1. Create a budget and stick to it
Buyers should get pre-approved by one or more lenders to ensure no delays. In addition, budgeting also means taking into account the additional costs such as taxes, utilities and insurance. Buyers should be aware that when listings are scarce the possibility of a bidding war becomes much higher, which means they should be prepared to walk in the event the bidding exceeds their budget.
2. Identify your wants versus needs
Wish lists might need to be compromised on if competition is too intense. For example, you might want a stainless appliance or hardwood flooring, but do you really need it? These can always be added later, the NAR points out.
“However, if a buyer wants to be in a specific school district or have a decent-sized backyard, those cannot be addressed later and must be taken into account during the house hunting process,” the NAR said.
3. Decide quickly
Properties rarely stay on the market for long when things are so competitive. As such, buyers need to learn not too hesitate if they find a house that suits their needs.
4. Make sure your offer is competitive
In a seller’s market a lowball offer just won’t work, the NAR advises. As such buyers should go ahead and make their best offer right away or risk losing out. Still, the NAR warns that when multiple bidders are competing for the same property the highest bid may not always win, but says bids with fewer contingencies will surely be very attractive.
“Removing restrictions related to the sale of a current home and being flexible with things like the move-in date can make a bid stand out to a seller,” the NAR said.
5. Use a realtor
The NAR also urges buyers to work with a real estate professional, as they are more likely to be familiar with suitable neighborhoods they’re looking for.
Smart-home features can boost a home’s sale value by up to 5 percent. That totals about $15,000 on a $300,000 home—no chump change to a seller.
Home appraisers are now starting to factor in the value of smart-home features into their valuations as well, according to a recent article at realtor.com®.
So what exactly are the perks of a smart home if you ever find you’re selling one? The article points to some of the following benefits:
Smart homes are safer. A survey by August Home, which makes smart door locks, found that 63 percent of consumers cite home security as the biggest motivation to buy a smart-home device. Numerous smart-home devices are aimed at beefing up a home’s security, from cameras that can detect break-ins to safety devices that can detect smoke, fire, carbon monoxide, and moisture levels. Homeowners can activate their smart locks from anywhere, locking or unlocking them as needed.
Smart homes can save money. Nest boasts that its smart thermostat can save consumers an average of 10 to 12 percent on heating costs and 15 percent on cooling costs. That could translate to about $131 to $145 a year. Smart lighting, dishwashers, and water-efficient laundry machines boast more potential savings.
Smart homes can save you time and stress. Smart homes promise to make homeowners’ lives easier. You can operate or monitor a home’s systems and appliances via your smartphone or even through voice-assistance devices, like Amazon Echo or Google Home.
They’re easy to use. Many smart-home devices operate wirelessly and often can be controlled by your smartphone or tablet. You don’t have to be tech-savvy to install or operate them.
Home sales reached their highest pace in a decade in the first quarter of 2017 as property prices continue to escalate, according to the National Association of REALTORS®’ latest quarterly report.
The median price of an existing single-family home nationally was $232,100 in the first quarter, up 6.9 percent from the same time period a year ago. Home prices rose year over year in 85 percent of the 178 metro areas analyzed.
The continued inventory shortages prompted home-price appreciation to quicken its pace in the first quarter, says NAR chief economist Lawrence Yun.
“Prospective buyers poured into the market to start the year, and while the increased presence led to a boost in sales, new listings failed to keep up and hovered around record lows all quarter,” Yun says. “Those able to successfully buy most likely had to outbid others—especially for those in the starter-home market—which in turn quickened price growth to the fastest quarterly pace in almost two years.”
By Region
Here is a closer look at how existing-home sales performed across the country in the first quarter:
Northeast: Existing-home sales dropped 2.2 percent but remain 4.2 percent above the first quarter of 2016. Median single-family home price: $255,000, up 2.2 percent from a year ago.
Midwest: Existing-home sales fell 4.3 percent in the first quarter but remain 1.6 percent higher than a year ago. Median single-family home price: $176,600, up 5.7 percent from a year ago.
South: Existing-home sales increased 5.8 percent in the first quarter and are 5.8 percent higher than a year ago. Median single-family home price: $209,000, up 8.8. percent a year ago.
West: Existing-home sales rose 1.6 percent in the first quarter and are 7.4 percent higher than a year ago. Median single-family home price: $342,500, up 8.4 percent from the first quarter of 2016.
Thirty metros saw double-digit price increases in the first quarter, NAR’s report shows. “Several metro areas with the healthiest job gains in recent years continue to see a large upswing in buyer demand but lack the commensurate ramp in new-home construction,” Yun says. “This is why many of these areas—in particular several parts of the South and West—are seeing unhealthy price appreciation that far exceeds incomes.”
The Commerce Department also reported Tuesday that overall home construction fell from March to April, with housing starts declining 2.6 percent month-over-month. This could have a broader impact on the economy, Yun adds. “With housing starts declining in April, inventory shortages will continue for a longer period of time. The intensifying housing shortage will push up home prices and rents, and easily above wage growth and the broad consumer price inflation. This continued, slow pace of construction of new homes is a major bottleneck to a faster economic and housing recovery.”
Affordability weakened slightly nationwide in the first quarter, despite a rise in the national family median income to $71,201. Higher mortgage rates and home prices softened affordability compared to a year ago, NAR reports. To buy at the national median price, a buyer making a 5 percent down payment would need an income of $52,251; a buyer with a 10 percent down payment would need to earn $49,501; and a buyer with a 20 percent down payment would need to earn $44,001, according to NAR.
Total existing-home sales in the first quarter, including single-family homes and condos, rose 1.4 percent to a seasonally adjusted annual rate of 5.62 million. That is the highest since the first quarter of 2007, when it stood at 5.66 million sales.
“Last quarter’s robust pace of sales was especially impressive considering the affordability sting buyers experienced from higher prices and mortgage rates,” Yun says. “High demand is poised to continue heading into the summer as long as job gains continue. However, many metro areas need to see a significant rise in new and existing inventory to meet this demand and cool down price growth.”
At the end of the first quarter, 1.83 million existing homes were available for sale—6.6 percent below inventory levels of a year ago. The average supply during the first quarter was 3.7 months, NAR reports.
And there are plenty to go around. Rocky. Steve Jobs. The Chicago Cubs. Jesus. Lil Bub (Google her!). And, with apologies to Jesus, perhaps the most impressive comeback of all, the one that hits us exactly where we live: the housing industry.
–– ADVERTISEMENT ––
After all, the 2007 real estate crash was a trauma that cut a wide swath of destruction through the ranks of home buyers, sellers and owners—and just about everyone affected by the bleak recession that followed. Although it has taken several agonizing years, the housing market is finally looking good again in much of America. A classic comeback! Cue the Rocky theme…
But wait, there’s a twist to this tale: The path to housing recovery has not run smoothly across the United States. Some cities have rebuilt and recovered. Some are back even stronger than they were in their heady, pre-crash salad days. And yet others continue to flounder, plagued by swaths of bank-owned homes.
The median home price bounded back to $227,000 nationally last year, already higher than the market peak of $220,400 back in 2005. Compared to the rock-bottom level in 2011, home prices have improved by 26%. (Adjusted for inflation, the current prices have recouped about 80% of their peak value.)
“Nationally, median home prices have more than fully recovered,” says Joe Kirchner, senior economist at realtor.com®. “But at the local level, some markets have not yet followed suit.”
The post-crash haves and have-nots
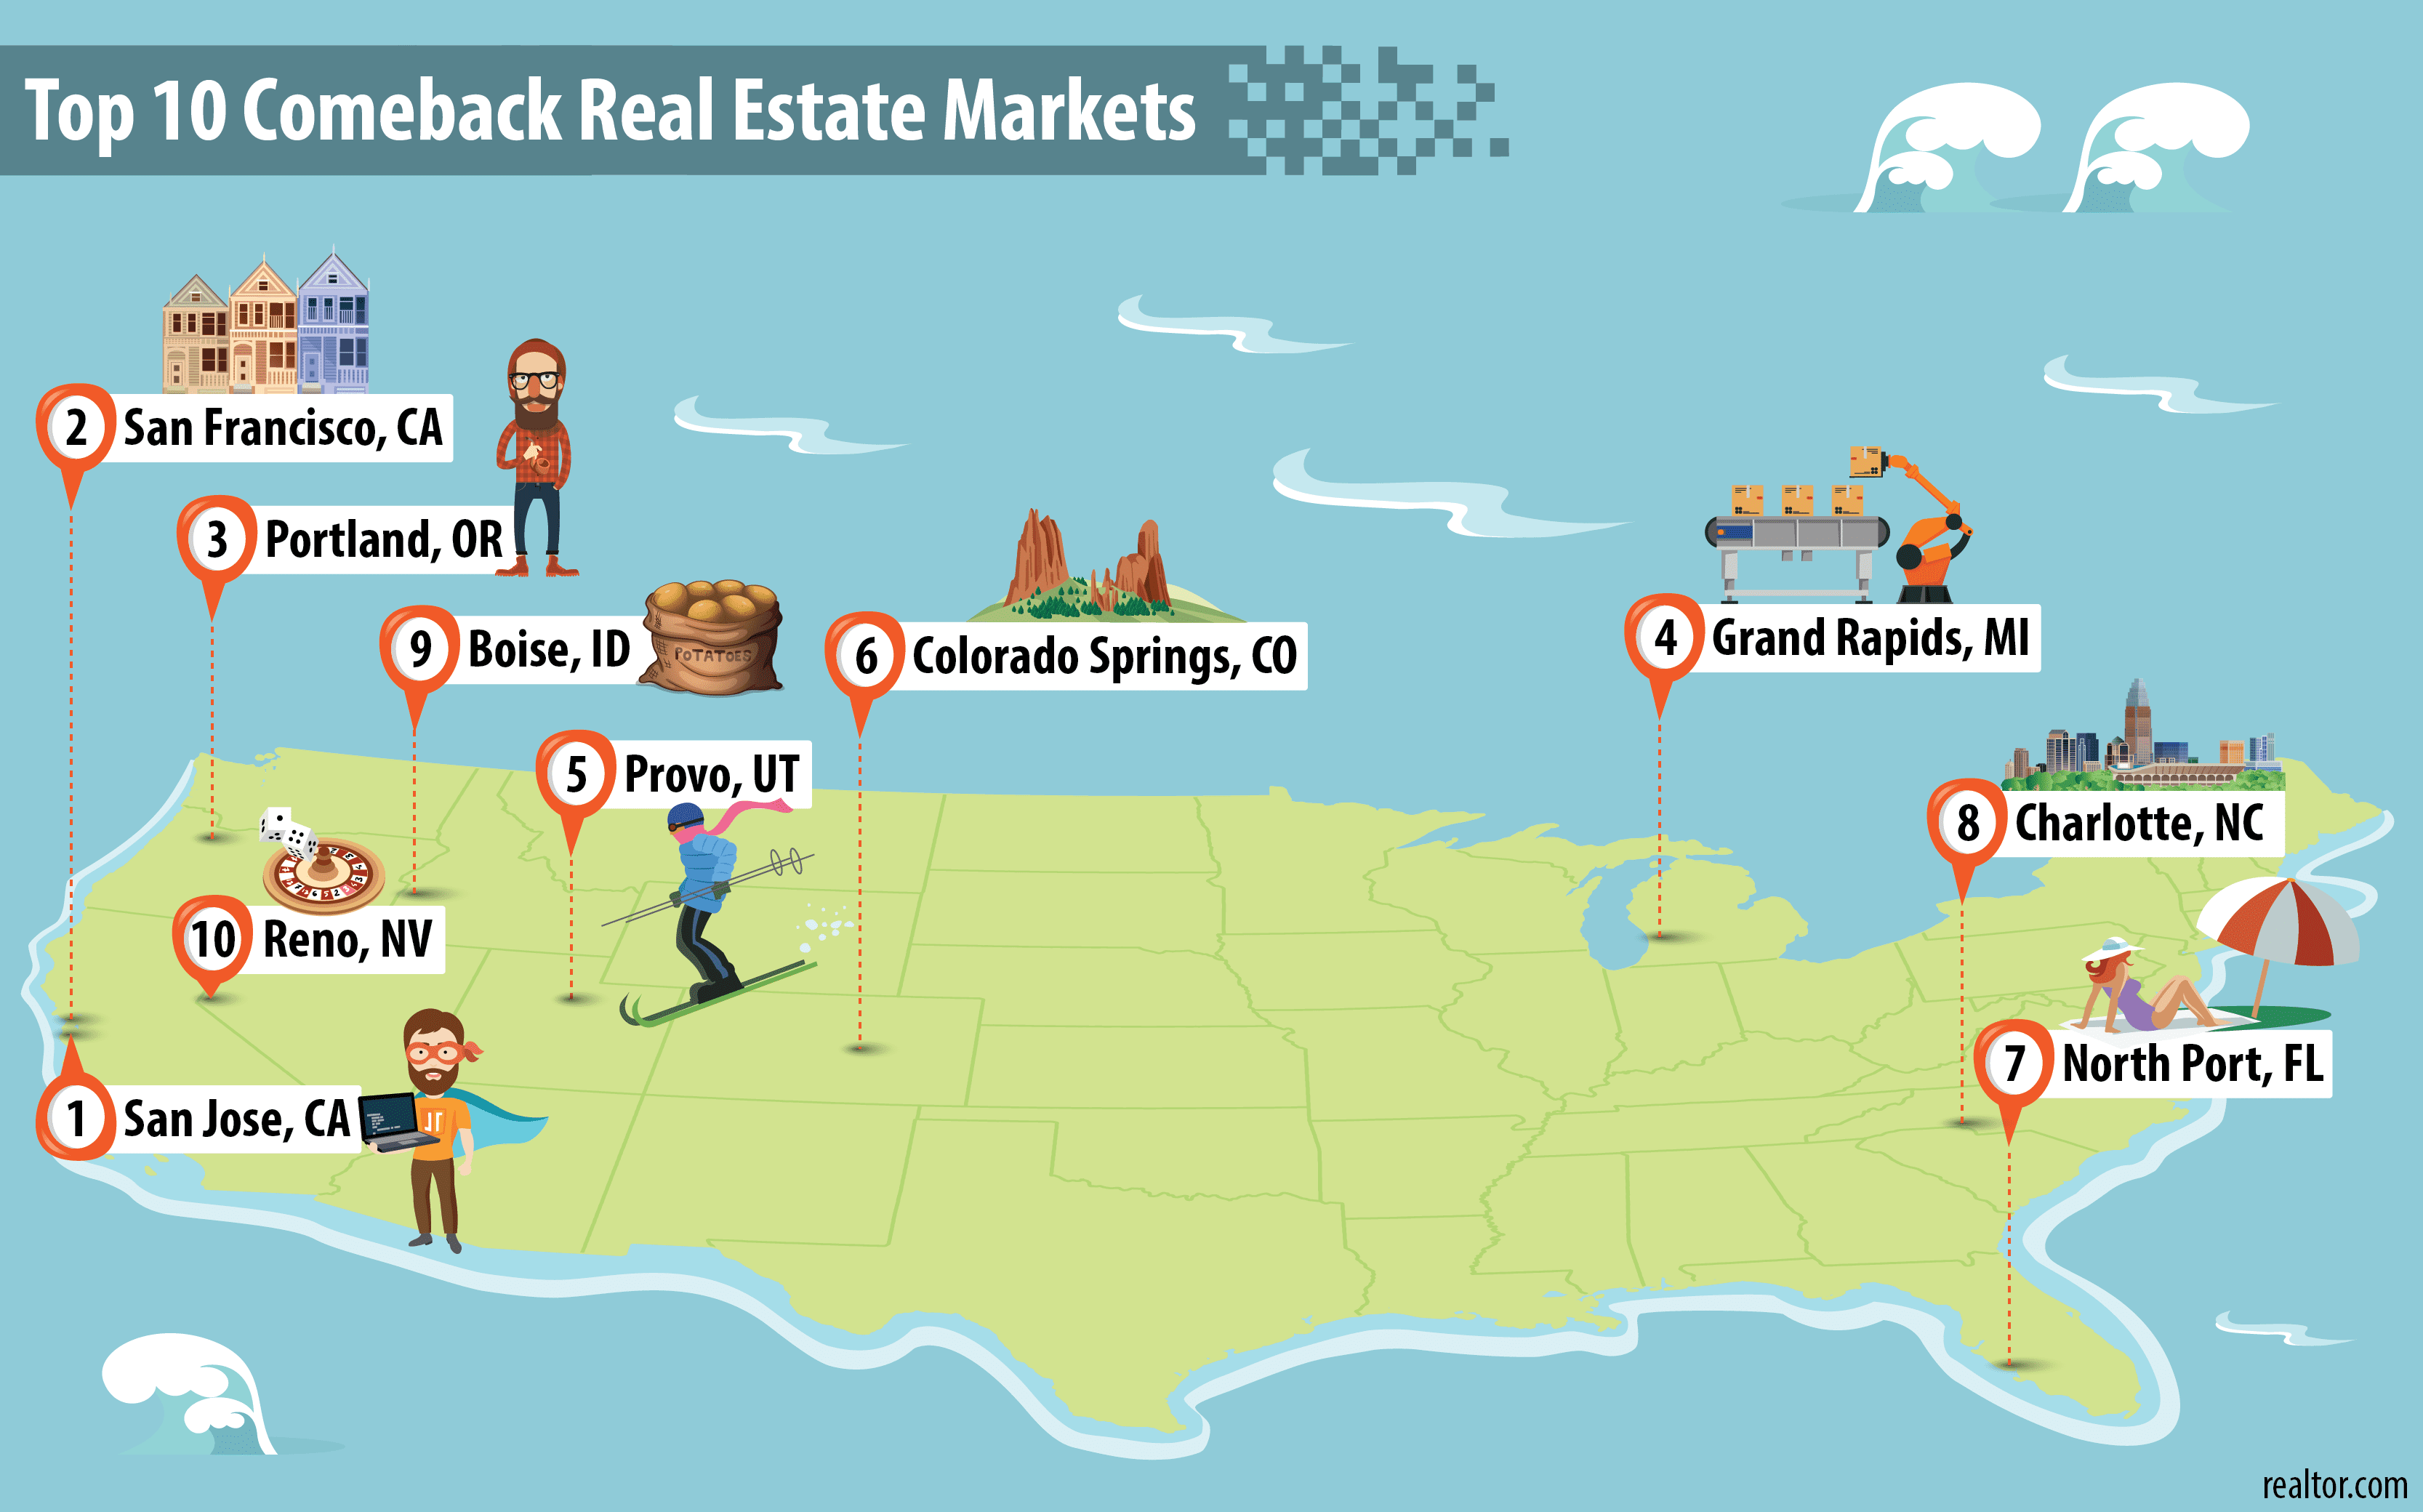
So the data team at realtor.com® decided to figure out which parts of the country have recovered the best from the housing bust: the true comeback kids! We took the150 biggest metros around the country, factored in their highest, pre-recession home-price heights, their lowest lows of the crash—and which ones rebounded best through 2016. We measured the recovery by measuring home prices, the amount of new home construction, foreclosure and unemployment rates and the household income of local residents in 2016.
(Metropolitan statistical areas, as defined by the federal Office of Management and Budget, are highly populated, geographical areas made up of one or more city cores surrounded by suburban and rural communities closely tied to that core.)
To ensure a fair comparison, we excluded markets that didn’t experience much hardship. After all, to compare the recovery in Austin, TX (which barely had a blip), with Las Vegas (famously choked by foreclosures), would be comparing apples to oranges—or maybe Craisins.
So what did we find? The cities that achieved some of the speediest and most definitive recoveries have been the knowledge hubs—places clogged with colleges, research centers and young brainiacs, where a nimble, educated workforce helped attract new businesses. And cities that have done a good job diversifying their economy have also been big real estate winners in the past decade.
Ready? Let’s go back to the future and celebrate some of the best comeback stories around.
Post-crash price growth (since the trough in 2011):57%
Median home price in2016: $835,200
California experienced one of the nation’s worst foreclosure crises after consecutive years of skyrocketing home prices, greedy speculation, and go-go building frenzy. Silicon Valley, up north, fared better than Southern California, but home prices still tumbled 24% from their peak, more than the national average of 18%. And as layoffs piled up in the San Jose metro starting in 2008, the unemployment rate shot up from 6.1% to 11% in just one year (2008 to 2009). It was a lousy year.
But Silicon Valley was among the first to shake off the economic malaise, fueled by a new and even more frenetic tech boom. High-profile IPOs like those of Tesla (2010) and Facebook (2012) increased morale as venture capital money poured in—and new startups just kept popping up. For each new software company, the city needed more engineers, more designers, more receptionists, more cleaners, More of everything. So the job market heated up faster than a circa 2005 PowerBook.
In the post-recession era, the San Jose metro holds tightly on to its position as one of the hottest housing markets in the country. Foreclosures are virtually nonexistent—less than 1% of homes filed last year. And new home construction has also picked up ahead of the country.
As in San Jose, the housing collapse magnified the recession in the San Francisco metro, because prices were unreasonably inflated in the bubble. This was one big bubble! At the lowest point, in 2011, home prices slipped to $493,100, down 30% from the peak in 2007.
The job market cratered, with the unemployment rate surging to 9.9% in 2010, slightly worse than the atrocious national average of 9.6%. Macy’s eliminated its 1,400-person Macy’s West division in San Francisco, the San Francisco Chronicle newspaper almost went bankrupt, and hundreds of stores and restaurants shuttered their doors.
However, young techies tried to embrace the situation with humor. “Funemployment” became a common buzzword, as they used their jobless time to travel, enjoy long, boozy lunches, and chill with friends. They knew the tech business wasn’t vanishing, even if their current jobs had.
The optimism kept talent from leaving San Francisco, which helped speed up the tech biz recovery. Now-successful companies like Uber and Pinterest were founded during the worst time, and startup ideas were bubbling up all over. The local powerhouses Twitter and Yelp went public in 2012, helping to accelerate the growth.
“Those IPOs created many new millionaires. One moment you were living in a studio apartment, eating takeout food; the next moment, you are rich,” says Patrick Carlisle, chief market analyst of Paragon Real Estate Group. “When people become newly wealthy, the first thing they think of is, ‘Hey I want to own my own home,’ or ‘I want a bigger home.'”
Back in the 2004-07 housing run-up, Portland’s Kruse Way was known as “Mortgage Row,” because it was packed with real estate companies and mortgage firms. After the crash, many of those companies closed up shop, and the same street was dotted with ads for cheap office space. Indications of the depression ranged from foreclosed signs outside suburban homes to empty storefronts on the famous 23rd Avenue shopping strip.
In 2009, the city had a scary-high unemployment rate of 10.9%. A deepwater port on the Columbia River, Portland’s economy relied largely on global trade. But the crash hit those businesses hard. Trade was squeezed, stevedores and warehouse workers were out of jobs, and manufacturing slowed to a crawl.
The good news was that people never stopped moving here. Since the 1990s, people had been lured by the city’s tolerant, offbeat, bicycle-powered lifestyle, and the great outdoors. That population growth kept the local economy afloat.
And then high-tech companies spearheaded the recovery. Young firms like Puppet Labs and Jama Software grew rapidly after the recession. Portland’s own homegrown corporate powers, like Nike and Columbia Sportswear, regained strength, while maintaining competitive wages. In 2017, the Portland metro has the nation’s fastest-growing economy, according to the real estate firm HFF.
This manufacturing hub long touted its nickname of “Furniture City,” for making fine office desks and other furniture. But who the heck needs office desks when the country is in a deep recession? Thousands of gigs were moved overseas. Big companies like Herman Miller announced major layoffs, smaller ones like Klingman’s closed doors under towering debt. In 2009, 1 in 9 workers in Grand Rapids was out of a job.
But the city snapped back, with a newfound emphasis on the health care industry. The world-class oncology research center the Van Andel Institute and Michigan State University’s brand-new biomedical research center led the charge. Manufacturing expanded beyond furniture making to medical devices, aerospace and defense, and information technology.
“When you don’t put all your eggs in one basket, you recover a lot faster,” says Tim Mroz, vice president of the Right Place, which helps local business development.
Since 2011, housing prices have been booming, with 5% growth each year.
Brigham Young University largely shielded Provo, just outside Salt Lake City, from disastrous unemployment during the recession, but it couldn’t save the real estate market. It only took two years (from 2007 to 2009) for home prices to crash 26% from their peak to the bottom. A sharp decline in construction also left the housing market lifeless.
But things turned around quickly. As early as 2010, cranes were back at work on a new convention center downtown, and then on the expansion of the headquarters of NuSkin, the maker of dietary supplements. The sound of trucks and jackhammers resurfaced in the suburbs as well, signaling more single-family homes, as well as a job revival in the construction industry.
The low cost of living and affordable homes also encouraged millennials into homeownership. In 2015, Provo was one of the top markets for first-time buyers to take out a mortgage.
In the recent recession, Colorado Springs got a new motto: “Do-it-yourself government.” Volunteers could adopt a street light, because one-third of the city’s street lights were turned off to save money, or adopt a trash can so that the city could afford to collect trash from parks. As city mottos go, this one left something to be desired.
Household income in Colorado Springs shrank to $51,700 at the bottom of the recession, $7,200 less than at its highest point, in 2008.
But proximity helped. Just an hour south of recession-proof Denver, and shielded from the downturn by a booming energy sector, Colorado Springs boasted homes about one-third cheaper, making it a great deal for commuters. New home construction is now booming, especially in the northern part of town.
“We were languishing behind the rest of Colorado, but that’s really reversed in the last several years,” says Daphne Greenwood, an economics professor at the University of Colorado-Colorado Springs.
Southern Florida was the poster child of the subprime mortgage crisis. The skyrocketing prices in the early 2000s housing run-up were fueled by debt and starry-eyed investors, rather than those who could actually afford the homes. Then prices crashed fast and hard.
Among the hardest-hit was the North Port-Sarasota metro area, a collection of mostly retirement communities an hour south of Tampa. Home values vaporized by 40% from 2006 to 2011, as many potential buyers’ savings and retirement funds took a hit. At the very worst point, 1 in 4 homes filed for foreclosure. From there, a hard slog back began.
“We have had a lot of gains since then, because we were so far behind,” says Dan Heschmeyer, a broker at Gulf Coast Realty Team. “But the market has been on fire again. The baby boomers are in full retirement years, and we are still one of the best destinations for retirement.”
Unlike sprawling Tampa, the North Port metro consists of smaller, more friendly communities for retirees. Sarasota and Venice, with vibrant cultural arts scenes, white-sand beaches, and historical downtowns, are famous for well-heeled residents. Since the market bottomed out in 2011, home prices have recorded an 8% annual price growth.
America’s financial hub was also at the center of an economic slowdown in the recession. From Wells Fargo to BB&T, Charlotte’s financial world was struck by massive layoffs. The unemployment rate swelled to a whopping 12% in 2009.
The road to recovery started with an expanding local economy—extending beyond the financial sector. The city has won thousands of jobs by persuading companies to relocate with the promise of tax breaks. The home-appliance manufacturer Electrolux moved in its North American headquarters, and the insurance company MetLife put its retail business in Charlotte.
Business and population expansion jump-started the stalled construction industry. Condos and apartments sprouted in and around downtown, including luxury buildings with pet- washing stations and HGTV-inspired kitchens. And home prices came back.
At the lowest point of the Great Recession, virtually the only sector in Boise that was holding on was the government. Barely. The semiconductor producer Micron Technology, once Idaho’s largest private employer, slashed 2,000 jobs. Years of overbuilding in the suburbs resulted in more homes for sale than buyers—causing home prices to fall 35%.
To pull itself out of the downturn, Boise poached from the tech industry to diversify its economy, marketing itself as an affordable launching pad for startups. Today, the Boise Valley is home to more than 400 tech companies, from Hewlett-Packard to startups like GenZ, which develops agricultural technology.
As the economy turned around, house prices have marked a five-year streak of steady growth since 2011.
The recession walloped Reno’s gambling industry, leaving the city with empty casinos and scores of vacant, bank-owned homes. More than 40% of local homes were foreclosed on in 2009, and hundreds of homeless people set up an encampment downtown. The free fall of home prices didn’t stop until 2011. By then, many homes had lost half the value they had in 2005.
“The recession made people aware that we need a diversified economy. Relying entirely on the gambling and tourism industry is not a durable strategy,” says Mehmet Serkan Tosun, an economics professor at the University of Nevada-Reno. The new strategy? Making Reno a haven for doing business: offering cheap real estate, virtually no corporate taxes and no personal income taxes, and investing in higher education to supply more skilled workers.
Reno has since scored big names like Tesla, Apple and the data security company Switch. And those casinos? They’re filling up again. Put your chips on black. Trust us.
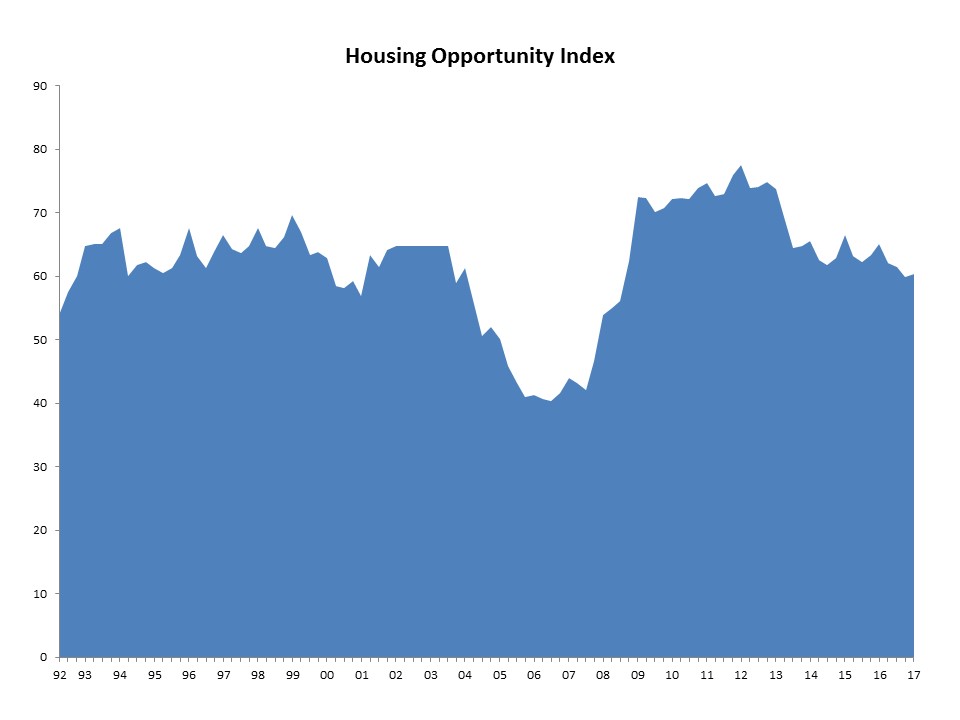
Rising wages helped to boost housing affordability in the first quarter, even as interest rates rose. The National Association of Home Builders (NAHB) said its NAHB/Wells Fargo Housing Opportunity Index indicates that 60.3 percent of new and existing homes that sold nationwide between the beginning of January and end of March were affordable to families earning the U.S. median income of $68,000. In the fourth quarter of 2016 59.9 percent of U.S. homes met that criteria.
NAHB said moderating home prices also played a role in the increased affordability. The national median home price fell to $245,000 compared to $250,000 in the final quarter of 2016, helping to offset the near half-point increase in mortgage rates. The average rate increased from 3.84 percent in the fourth quarter to 4.33 percent in the first quarter.
“Builders are reporting confidence and solid traffic in many markets across the nation even as they continue to grapple with nagging headwinds,” said NAHB Chairman Granger MacDonald. “Regulatory constraints, trade barriers on Canadian softwood lumber, and persistent shortages of lots and labor are slowing the pace of the housing recovery.”
“Ongoing job growth continues to fuel demand for housing, while wage growth is helping to offset the effects of rising mortgage rates and keep home prices affordable,” said NAHB Chief Economist Robert Dietz. “NAHB anticipates that housing will continue on a gradual, upward path throughout the year.”
The Youngstown-Warren-Boardman (Ohio/Pennsylvania) MSA was rated the nation’s most affordable major housing market for the second straight quarter with 92.7 percent of homes sold being affordable to families earning the area’s median income of $54,600. Rounding out the top five affordable major housing markets in respective order were Elgin, Illinois; Scranton-Wilkes Barre, Buffalo-Niagara Falls, and Syracuse.
Meanwhile, Kokomo, Indiana, was rated the nation’s most affordable smaller market, with 96.3 percent of homes sold in the first quarter being affordable to families earning the median income of $62,500. Other affordable small markets at the top of the list included Glen Falls, New York; East Stroudsburg, Pennsylvania; Binghamton, and Lansing-East Lansing.
For the 18th consecutive quarter, the San Francisco metro area was the nation’s least affordable major housing market. There, just 11.8 percent of homes sold in the first quarter were affordable to families earning the area’s median income of $108,400. All the remaining least affordable markets were also in California; Los Angeles, Anaheim, and San Diego which tied with San Jose at number five.
California was home to all five least affordable small housing markets as well. At the very bottom of the affordability chart was Salinas, where 13.8 percent of the quarter’s home sales were affordable to families earning the area’s median income of $63,100. It was followed by Santa Cruz, Napa; San Luis Obispo, and San Rafael.
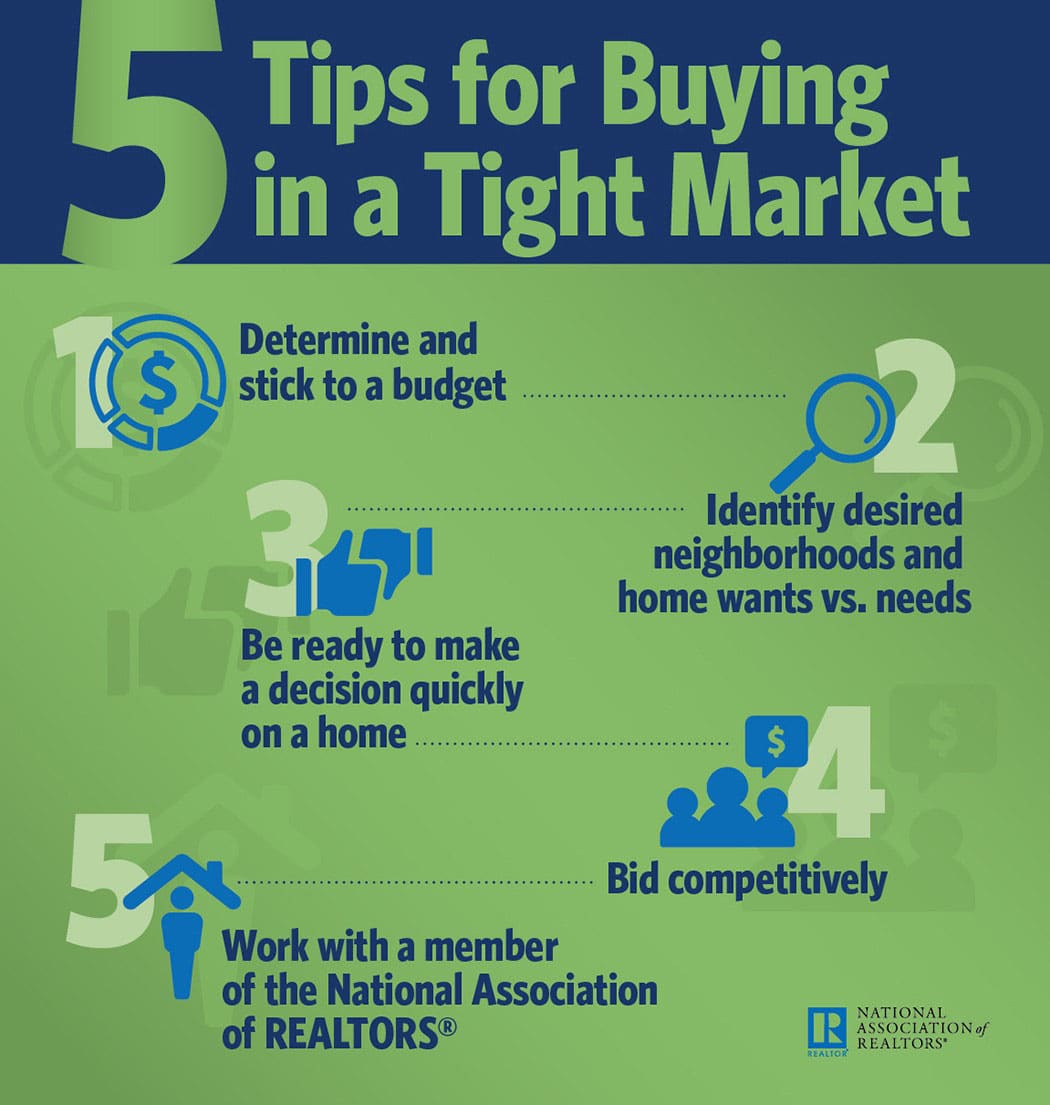
WASHINGTON, May 12, 2017 /PRNewswire/ — When inventory is low, home prices tend to go up. Attempting to purchase a house in this type of market can make the already complex process of buying a home even more overwhelming. To help buyers successfully get through the buying process in a tight inventory market with as little stress and difficulty as possible, the National Association of Realtors® has these five suggestions and an infographic: https://www.nar.realtor/infographics/5-tips-for-buying-in-a-tight-market.
Determine and stick to a budget. Before beginning the house hunting process, prospective homebuyers should receive preapproval from one or more lenders to verify the amount of money they are qualified to borrow. Then, after taking into account additional costs of ownership such as taxes, utilities and insurance, buyers should determine a final budget they can comfortably afford. When listings are scarce, bidding wars can drive up prices, so buyers must be prepared to walk away if the asking price surpasses their budget.
Identify desired neighborhoods and home wants versus needs. When housing inventory is tight, buyers may need to compromise on what they believe they want from a home. Certain wants, such as stainless appliances or hardwood floors, can be added later. However, if a buyer wants to be in a specific school district or have a decent sized backyard, those cannot be addressed later and must be taken into account during the house hunting process.
Be ready to make a decision quickly. In a seller’s market, homes rarely stay on the market long, so when a house that is in their budget and checks off all of their needs come along, buyers should not hesitate. Buyers should be ready to submit an offer quickly, or they may risk missing out on the home altogether.
Bid competitively and limit contingencies. It is tempting to submit a low offer as a starting bid, but in a seller’s market buyers need to put forward their highest offer from the very beginning or they are likely to lose out on the home. It is also important to remember that in multiple bidding situations it is not always the highest offer that is most attractive to the seller but the one with the fewest contingencies. Removing restrictions related to the sale of a current home and being flexible with things like the move-in date can make a bid stand out to a seller.
Work with a Realtor®. All real estate is local, so it is important to work with an agent who is a Realtor®, a member of the National Association of Realtors®, and who is familiar with the areas and neighborhoods the homebuyers are considering. Realtors® are the most trusted resource for real estate information and have unparalleled knowledge of their communities; they can give buyers the competitive advantage needed in a tight market.
The 30-year fixed-rate mortgage continues to hover around 4 percent for the fourth consecutive week.
“Mixed economic reports over the last week have anchored the 30-year mortgage rate around the 4 percent mark,” says Sean Becketti, Freddie Mac’s chief economist.
Freddie Mac reports the following national averages for the week ending May 11:
30-year fixed-rate mortgages: averaged 4.05 percent, with an average 0.5 point, rising from last week’s 4.02 percent average. Last year at this time, 30-year rates averaged 3.57 percent.
15-year fixed-rate mortgages: averaged 3.29 percent, with an average 0.5 point, rising from last week’s 3.27 percent. A year ago, 15-year rates averaged 2.81 percent.
5-year hybrid adjustable-rate mortgages: averaged 3.14 percent, with an average 0.5 point, rising from last week’s 3.13 percent average. Last year at this time, 5-year ARMs averaged 2.78 percent.
Forty-nine percent of those who don’t own their homes say they expect to purchase a home within the next five years. Ten percent say they plan to buy within the next year, according to a recent survey by Gallup of more than 1,500 adults. An additional 20 percent of non-homeowners say they plan to become homeowners within 10 years.
That leaves only 28 percent who say they have no plans to buy a home, according to the Gallup poll.
The percentage of non-homeowners who are looking to buy has risen over the past year. Gallup’s survey from April 2016 showed 38 percent of non-homeowners did not intend to buy in the foreseeable future, and 41 percent said they would buy within five years.
The most willing buyers tend to be millennials and Generation X members. Fifty-two percent of respondents age 18 to 34 say they plan to buy within five years; that number is 58 percent for those age 35 to 54. Only 30 percent of non-homeowners over the age of 55 say they plan to buy within that time period.
The persistent constraints on housing supply, however, pose a big problem for those looking to buy. Home shoppers are facing a limited selection of homes for sale. And as more owners stay put, inventories are being constrained even more. Sixty-four percent of U.S. adults surveyed by Gallup say they do not think they’ll sell their home in the foreseeable future. Twenty percent of survey respondents say they expect to sell within the next five years, 13 percent plan to sell within the next 10 years, and just 4 percent say they plan to sell next year.
“If real estate demand continues to outpace real estate supply, home prices will continue to rise and could rise beyond what most Americans can afford,” says Jeffrey M. Jones, who reported the Gallup poll findings. “To the extent that happens, many would-be homeowners may not be able to achieve their goal of owning a home.”
In competitive housing markets across the country, making an offer that sticks has become increasingly difficult. Ensure your client doesn’t make the process even tougher by succumbing to one of these common mistakes.
Delaying
“Time kills deals,” says Andrew Sandholm of BOND New York Properties in New York. “Dragging your feet means you could wind up paying more in a bidding war situation or missing out on the property altogether.” Buyers need to be ready with their paperwork, such as bank statements, a preapproval letter, and documents supporting proof of funds, from the day they begin house-hunting mode. That way they can pounce quickly with an offer when they do find a home they like.
Making an offer for their preapproved amount
Smart buyers are getting preapproved to show a seller they’re financially able to purchase a home. However, Chuck Silverston, principal at Unlimited Sotheby’s International Realty in Brookline, Mass., warns buyers against using that document to come up with an offer amount.
“Many buyers come in with a preapproval for the exact offer price, but when you’re competing against other offers, including cash offers, you want to show financial strength,” Silverston says. “An exact preapproval could make a listing agent nervous because not only does the buyer not have any wiggle room to negotiate, but they might no longer qualify if interest rates rise.”
Submitting a lowball offer
Lowballing a seller often backfires, particularly in a seller’s market. “A lowball offer that isn’t backed up with math or comparable sales data is disrespectful and could turn off the seller and possibly mean you will miss out on the property completely,” Sandholm says.
Waiving inspection contingencies
“I don’t care whether it’s new construction or even your mom’s house you’re buying from her – get it inspected,” urges Joshua Jarvis of Jarvis Team Realty in Duluth, Ga. Further, if you waive the inspection contingency in your offer, you may lose the earnest money if you later back out of the deal.
Not presenting yourself well enough
In a seller’s market, buyers need to take steps to make sure they look good in the eyes of the seller. “In today’s highly competitive environment, the listing agent is trying to determine which buyer will be the easiest to deal with,” Silverston says. Buyers may want to avoid pointing out every defect, making nitpicky queries, or questioning the seller’s tastes.
You may need to do less convincing to get home shoppers to make their move in the housing market. Fannie Mae’s Home Purchase Sentiment Index rose 2.2 percentage points in April, with five of six components rising that measure confidence in buying, employment, household incomes, financing, and more.
The share of Americans who say now is a good time to buy rose 5 percentage points in April. However, the net share of those saying now is a good time to sell fell 5 percentage points, the index showed.
“The Home Purchase Sentiment Index returned to its longer-term trend line after reclaiming ground last month,” says Doug Duncan, Fannie Mae’s chief economist. “This is aligned with our market forecast of about 3 percent sales growth in 2017. Historically strong inflation-adjusted house price gains are tempering consumer sentiment, whereas consumer optimism regarding the ease of getting a mortgage reached a survey high. On balance, housing continues on a gradual growth track.”
Here are more findings from Fannie Mae’s Home Purchase Sentiment Index reading from April, which is based on a survey of about 1,000 consumers.
35%: the net share of Americans who say it’s a good time to buy a home, up 5 percentage points from March.
26%: the net percentage of consumers who say it’s a good time to sell, dropping 5 percentage points from last month’s all-time survey high.
45%: the net share of Americans who believe home prices will rise by 1 percentage point.
77%: the net share of consumers who say they’re not concerned about losing their job, up 7 percentage points from March.
13%: the net share of consumers who say their household income is significantly higher than it was 12 months ago, up 2 percentage points from March.