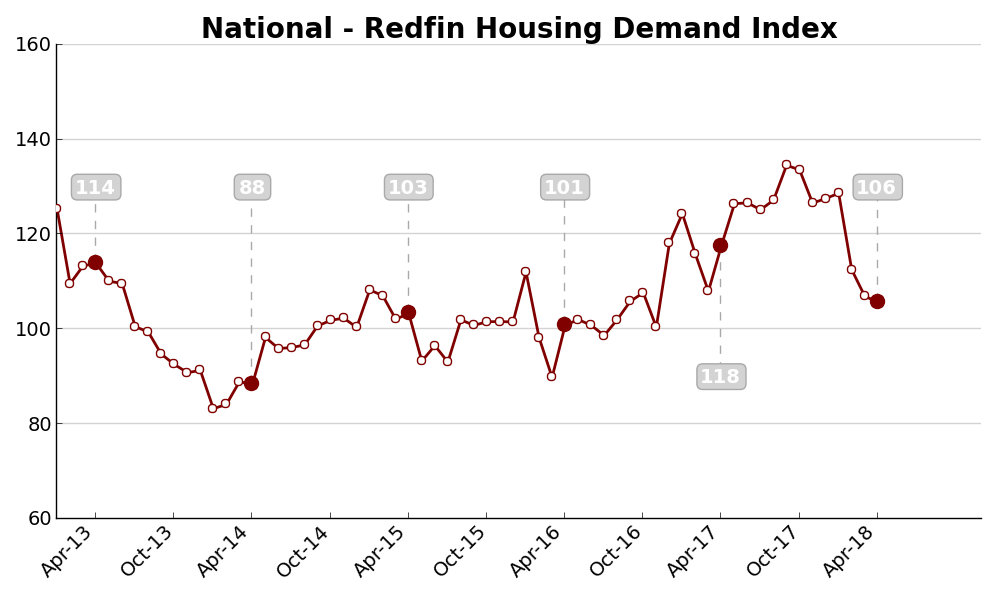
The Redfin Housing Demand Index fell 1.3 percent month over month to 106 in April, the third consecutive month of declines.
The Demand Index is based on thousands of Redfin customers requesting home tours and writing offers. The Demand Index is adjusted for Redfin’s market share growth. A level of 100 represents the historical average for the three-year period from January 2013 to December 2015
“April was the first time in 27 months that we saw a year-over-year decline in the number of customers touring homes,” said Redfin chief economist Nela Richardson. “We believe this was driven by the low levels of new listings in March. However, April’s 6.6 percent increase in new listings is a positive turn for homebuyers and bodes well for May and June home sales.”
From March to April, the seasonally adjusted number of buyers requesting home tours dropped 1.4 percent, while the number of buyers making offers fell 1.8 percent.
Looking at year-over-year comparisons, the Demand Index declined 11.5 percent from April 2017. The number of buyers requesting home tours dropped 3.7 percent year over year, and the number of buyers making offers fell 22.1 percent.
Across the 15 metros covered by the Demand Index, the number of homes for sale fell 7.3 percent year over year in April, the 35th consecutive month of falling supply. However, newly listed homes for sale increased 6.6 percent in April compared to a year earlier.
